
Covid-19 : In The Numbers
As we shelter in place, we watch the cases grow day after day and try to make meaning of it. California at 870 cases. Massachusetts at 256. Texas at 223. These are the latest numbers from Johns Hopkins (JHU) as of Wednesday, March 18.
What do these numbers mean? Are things getting better? We can’t tell from this. Unfortunately this is how many key news outlets, health, academic, and business organizations choose to update the situation, typically with a map overlay and big bold numbers (Figure 1, below). You can see many prime examples here - Center for Disease Control (CDC), World Health Organization (WHO), European Centre for Disease Prevention and Control, University of Washington, and Splunk (data/software/analytics company).

Figure 1 : Covid-19 dashboard from Johns Hopkins (JHU) Center for Disease Control (CDC)
Let’s look in the numbers.
We’re here to look at why the “Total Confirmed” is so prominent, why it doesn’t convey much about the current situation, and how we can understand the situation better by forecasting. Last of all we’ll bring this all together and explore what we should expect at state level (NY, CA, MA, and TX).
Why “Total Confirmed Cases” and What Does (and Doesn’t) Tell Us
As of right now the US has 9,415 totaled confirmed cases. Every country, state, province, region shares this figure because 1) tests are standardized and 2) it's the earliest, reliable point of detection for a systematic counter measure.
What does this number mean? The 9,415 cases is a relatively small number in comparison to the 35.5 M getting sick and 34,200 deaths CDC reported 2018-2019 flu season in the US. We had approximately 6,500 cases yesterday, so it appears cases are increasing fairly quickly. That’s what it tells us.
What does it NOT tell us? We know it doesn’t tell us the true number of cases out there. Collecting a single data point of a confirmed test needs to come from ground up - from the individuals who feel sick to feel the need to get tested, then reach testing sites, then given a test if there are enough tests, waiting for test results from 1 - 3 days ... and this continues until the information, the data point, of a “confirmed case” reaches the health organizations in turn share it with the public. There are lots of points of possible failure in this information chain, from lack of tests, to delay in test results, to possible result suppression, and more.
At this point it might seem that the 9,415 cases doesn’t tell us much, and doesn’t seem too reliable. Our information will get better with more, faster testing and sharing of data in the future.
For now, we have to follow the numbers assuming they reflect a proportion of cases and try to evaluate the numbers a little differently.
Knowing where we are going.
To understand the situation better we need to know where we are going. We’d like a vaccine, which is no where in the near future. Our second best outcome - seeing the total confirmed cases see slower growth, then come to a halt.
Are the US cases slowing down? For that we need to look at South Korea and Italy, two countries that had their outbreak 2 - 3 weeks earlier (Figure 2 below). The US had around the same number of cases of those countries on March 6 and 7th. By this date South Korea had drive-thru testing with 700x the testing capacity of the US and 8x of Italy, locked down the region of infection, and had swift quarantines for those testing positive. Meanwhile Italy doesn’t have lockdown until March 9th and is still ramping up on testing.

The US trajectory is more likely to mirror Italy than South Korea. The US is at 23 tests per million, while South Korea is at 5,500 per million. The US has more of a regional lock down, even with cases popping-up across the nation. We are following the footsteps of Italy and 14 days behind.
We can also compare the US to Germany. Germany has only just placed a township lockdown and has testing capacity of 72 per million. Look at our numbers below - US is also following Germany and is only 2 days away.

Given the experience we see in other countries, we know what works - testing and quarantines. One could argue there are many other factors at play including and not limited to demographic, population density, climate - and yes they still come into play. There's also a theory that warmer weather is hard for the virus to spread.
We know the case numbers should continue to grow and until we have testing and quarantines (or lockdowns) in place, they will continue to grow. What we hope to see is the day over day numbers start decreasing to witness the turning point where we can call some form of containment. We are looking for the day the rate change of cases starts to decline and approach 1. (Figure 4 below)

Based on the current rate of change, we should expect US confirmed case numbers to be at 230k by 3/28. (Figure 5, below) Italy may be on the verge of turning the corner if their rate of change continues their slide from 1.13. This is happening 10-11 days after their national lockdown.

What’s happening where we live? (In California, Massachusetts, Texas)
Most of the key health organizations are dedicated to the national and global scale of the problem. There are less forecasts and insights at the state level, but we can apply the same country-level analysis and forecasts to our state. It’s important, and very meaningful, to look at state-level cases and trajectory because the state responses have been different.
We start by looking at the state level growth rates (Figure 6).

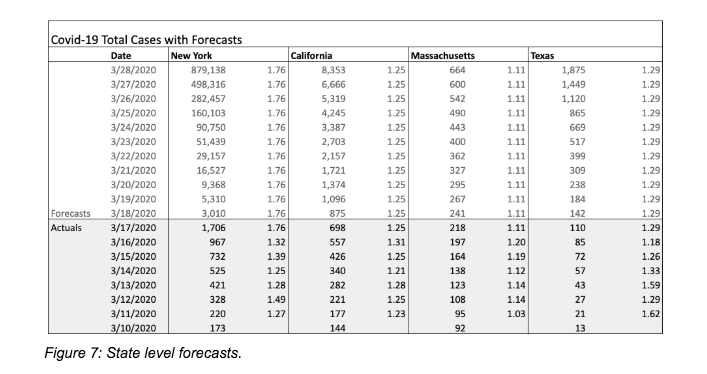
The above table shows actual data up to 3/17 and predicts the case numbers from 3/18 and later. You can check how close we are with the latest numbers here https://coronavirus.jhu.edu/map.html
With shelter in place orders and schools, businesses, restaurants starting earlier this week, the turnaround is still quite a few weeks away, if not more. Even when we start witnessing a change in rate, the cases will continue to build albeit at a slower pace.
In closing
We're looking at low case counts now, but expect a challenging road ahead with the exponential growth. Covid-19 is a highly communicable disease and we mentioned earlier many factors, when modeled, are irrelevant to something that shows such incredible growth.
That points to part of the solution for containment that many have seen and heard over and over again - social distancing. There's a great article from the Washington Post on social distancing and running various simulations of varying degrees of quarantine to flatten the curve. We can decrease the slope of the curve and when we do, our healthcare system will be able to handle the load. A great chart showing countries tha thave flattened the curve and those that have not https://www.visualcapitalist.com/infection-trajectory-flattening-the-covid19-curve/ The EU, UK, US are quite a ways away.
This is why no one thinks it will be over in 2-3 weeks, and shelter in place measures likely won’t be lifted for another 4-8 weeks.
Our sweeping measures only just began and it will take time to show.
FYI: If you're interested in the data, Johns Hopkins University publishes it here https://github.com/CSSEGISandData/COVID-19/tree/master/csse_covid_19_data